Carbon Index 2018: Welsh councils come out on top for carbon reduction
Simon Hann presents summary findings from Eunomia’s sixth annual Local Authority Recycling Carbon Index, highlighting the contribution of councils’ recycling services towards mitigating climate change
 Weather is not climate, but the UK’s unusually hot summer, set against the background of a global heatwave, might well turn one’s mind to the question of how we can individually take action to reduce carbon emissions.
Amongst the many benefits of recycling are that it avoids both the disposal of waste and the need for the extraction of raw materials. These result in a reduction in carbon dioxide emissions, enabling people to do something about greenhouse gases without even leaving the house. Eunomia’s Local Authority Recycling Carbon Index allows the performance of different councils to be compared by quantifying the reduction in CO2 equivalent emissions (CO2e) per person that each achieves through recycling.
The Carbon Index provides an alternative to tonnage-based recycling rates in assessing the performance of councils’ collection systems. Consider an authority that collects a lot of green waste for composting, for example, but rather less dry recycling. In tonnage terms, it may have a high recycling rate, but recycling metals, plastics and paper brings about greater carbon savings than does composting green waste, so such a council may occupy a rather lower rank on the Carbon Index.
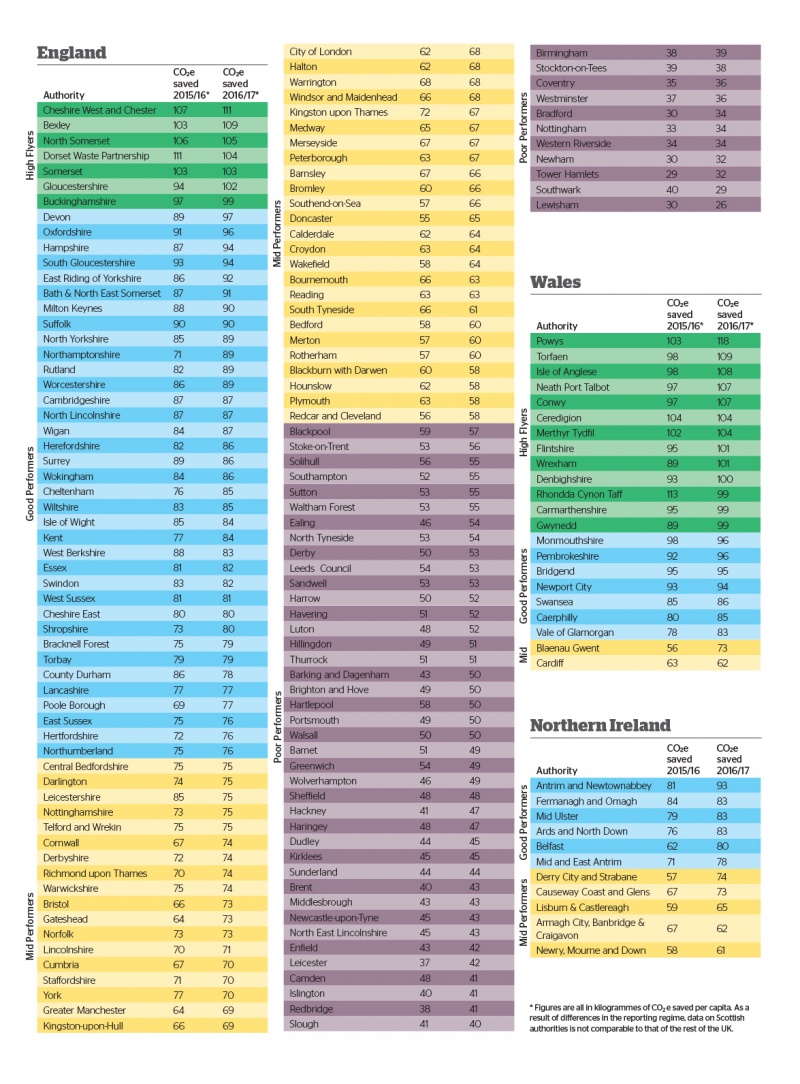
The latest edition of the index shows each of the three countries making progress. Northern Ireland saw the biggest increase in CO2e savings, rising by eight kilogrammes (kg) per person to 76kg in 2016/17. This may have been driven by service changes introduced by councils during the year, in preparation for the provision of separate food waste collections becoming compulsory in April 2017. Wales, though, retains a significant lead, adding 3kg per person to reach 94kg. England now lags a little behind, adding only 1kg per person in 2016/17 to reach 69kg.
Ten of Wales’ 22 authorities topped 100kg CO2e per person, while only seven of England’s 137 authorities reached that mark. In this context, it’s little surprise that a Welsh authority should lead the way – at 118kg CO2e saved per household, Powys County Council headed the Carbon Index for a second year in succession.
However, Powys’s lead narrowed considerably in 2016/17, with England’s best performing authority, Cheshire West and Chester, just 7kg per person behind. Northern Ireland’s top performer was Antrim and Newtownabbey Borough Council, which added an impressive 12kg CO2e per person over the mark it achieved in 2016/17 to reach 93kg.
 This article was taken from Issue 93
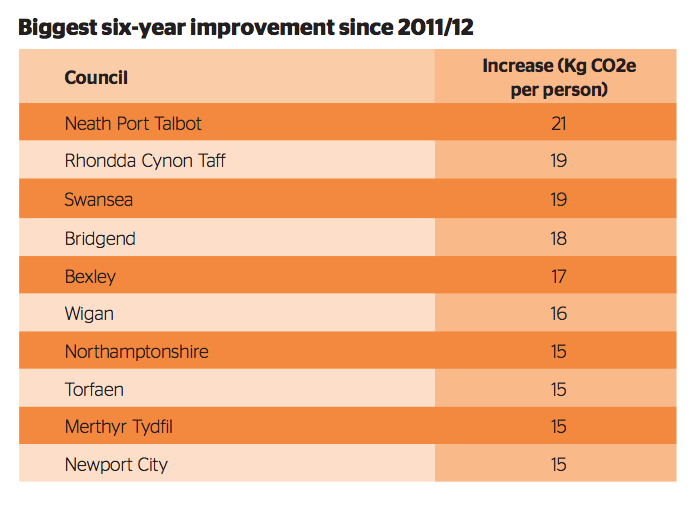
The 2016/17 Carbon Index is the sixth annual edition of the study, and it is perhaps timely to look back at how much progress has been made over that period. Wales was already in the lead in 2011/12, with councils overall saving 81kg CO2e per person. The 13kg increase achieved since then is a 16 per cent improvement. England was at 66kg CO2e per person in 2011/12 and has improved by 3kg (4.5 per cent). Northern Ireland was some way behind in 2011/12 at 60kg CO2e, but has achieved the biggest absolute (16kg) and percentage (26.7 per cent) increase. Every local authority’s historical performance can be viewed on the Carbon Index website at www.eunomia.co.uk/carbonindex, which also allows any two authorities’ performance to be compared.
No authorities have gone backwards in CO2e performance, but several have made little progress. The smallest increases in carbon savings have been achieved by Rotherham (2kg), Bradford (3kg) and Slough (3kg). All of these authorities are in the bottom half of the index; while each faces challenges, there are similar authorities that are doing considerably better. One of the key takeaways of the Carbon Index should be that there is scope for almost every authority to achieve greater CO2e reductions – and looking at the systems operated by high performers is a good place to start.


